
Table of Contents
1. Program Evaluation Review Technique (PERT)
2. Benchmarking
3. Activity Plan (Gantt Chart)
1. Program Evaluation Review Technique (PERT)
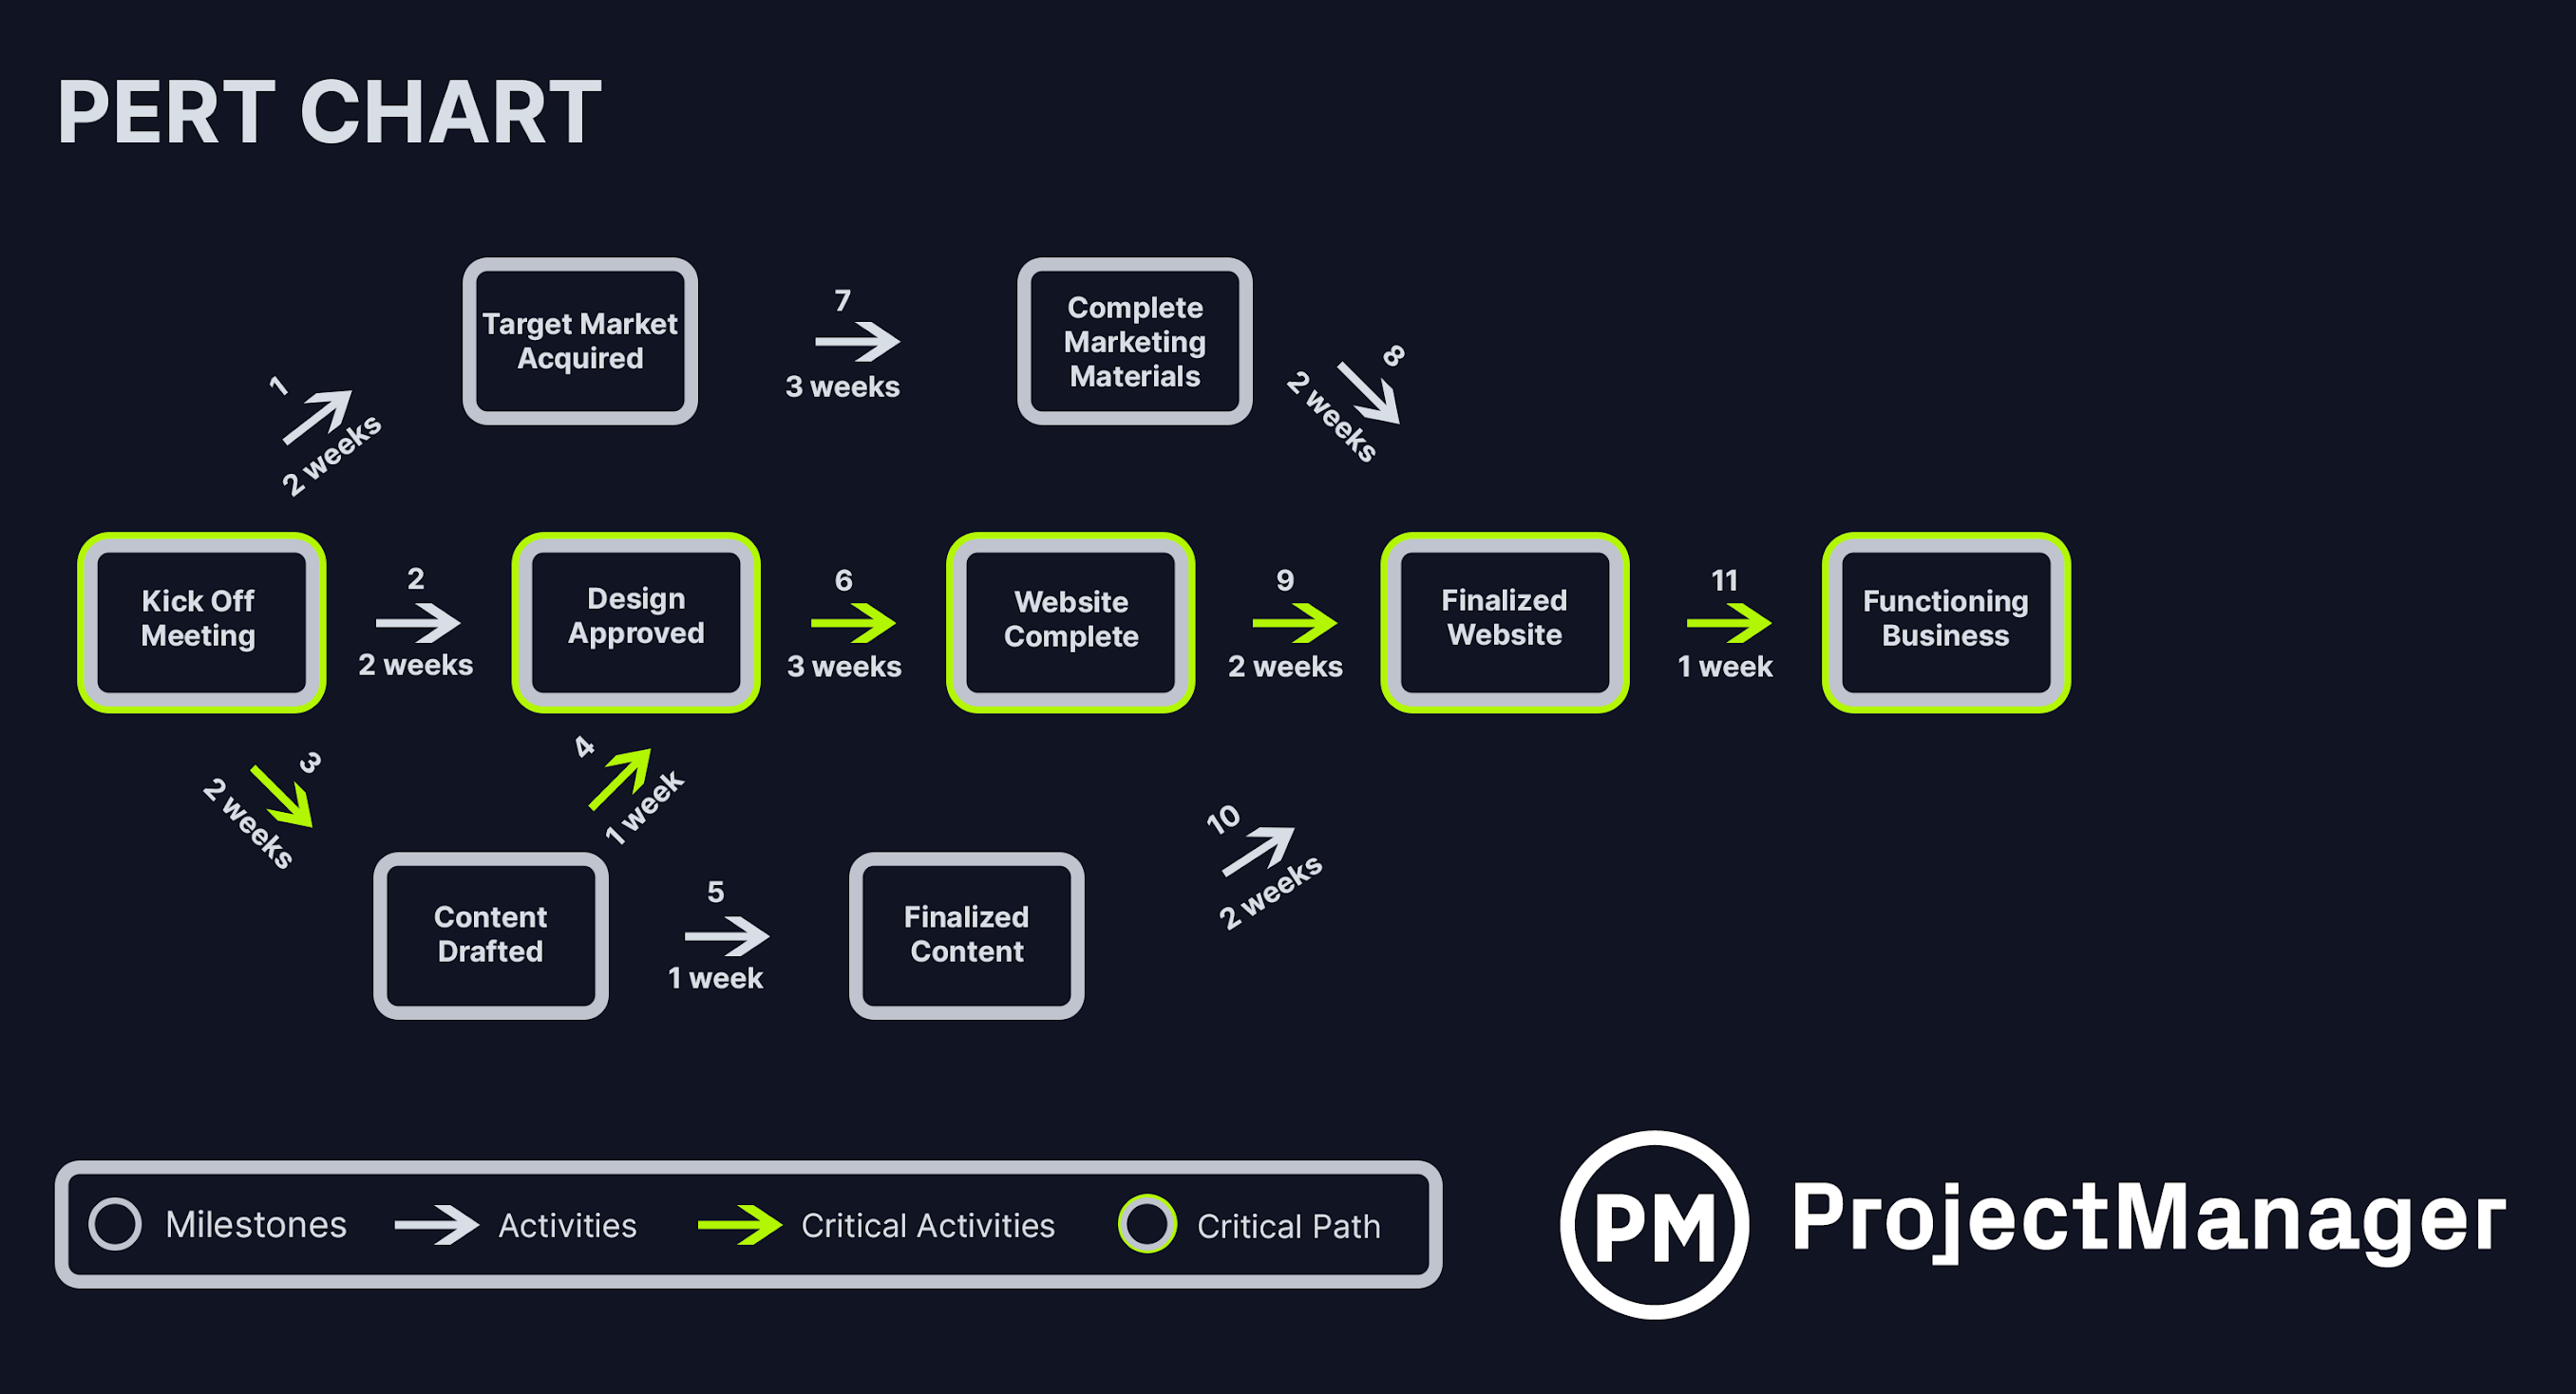
Definition: Program Evaluation Review Technique (PERT) is a project management tool used to schedule, organize, and coordinate tasks within complex projects. It enables planning and control of project activities when time estimates are uncertain.
PERT was developed in the late 1950s by the U.S. Navy for the Polaris submarine missile program. Today, it’s widely used in healthcare and nursing management for complex project planning, patient care coordination, and resource allocation.
:max_bytes(150000):strip_icc()/dotdash_Final_Program_Evaluation_Review_Technique_PERT_Chart_Oct_2020-01-d5cc04b8ad704760be3636dfabe55aa5.jpg)
Key Components of PERT
- Events/Nodes: Key milestones that mark the start or completion of activities, represented as circles or rectangles in PERT diagrams.
- Activities: Tasks that must be completed to progress from one event to another, represented as arrows between nodes.
- Dependencies: Relationships between activities showing which tasks must be completed before others can begin.
- Critical Path: The sequence of activities that determines the minimum project completion time.
- Slack Time: The amount of time an activity can be delayed without delaying the project completion.
- Time Estimates: Three time estimates for each activity – optimistic, pessimistic, and most likely.
The PERT Formula
PERT uses three time estimates to calculate the expected completion time for each activity:
Expected Time (TE) = (O + 4M + P) ÷ 6
Where: O = Optimistic time, M = Most likely time, P = Pessimistic time
This weighted average gives more importance to the most likely time estimate while accounting for best-case and worst-case scenarios.
The standard deviation for each activity can be calculated using:
Standard Deviation (σ) = (P – O) ÷ 6
The variance of an activity is the square of the standard deviation:
Variance (V) = [(P – O) ÷ 6]²
Applications of PERT in Nursing
PERT is particularly valuable in nursing management for:
Hospital Department Reorganization
Planning complex organizational changes with uncertain timeframes while maintaining patient care quality.
Staff Education Programs
Implementing new training initiatives with multiple interdependent components and varying completion times.
Electronic Health Record Implementation
Coordinating complex technical rollouts with training, data migration, and system testing.
Clinical Research Projects
Managing multi-phase research initiatives with uncertain durations and interdependent activities.
PERT Mnemonic: “P-E-R-T-S”
Remember PERT with “P-E-R-T-S”
- P – Pathways identified (map out all activities and their sequences)
- E – Estimates three-fold (optimistic, most likely, pessimistic)
- R – Relationships established (determine dependencies)
- T – Time calculated (apply the formula)
- S – Strategy for critical path (identify and monitor)
2. Benchmarking
Definition: Benchmarking is the process of comparing an organization’s performance metrics, practices, or processes against industry standards or best practices from other organizations to identify opportunities for improvement.
In healthcare and nursing management, benchmarking provides a systematic approach to measuring and improving patient care quality, operational efficiency, and clinical outcomes through structured comparisons and adoption of best practices.
Types of Benchmarking
| Type | Description | Nursing Examples |
|---|---|---|
| Internal | Comparing performance between departments, units, or facilities within the same organization | Comparing patient fall rates across different nursing units |
| Competitive | Comparing performance with direct competitors or similar healthcare facilities | Evaluating nurse-to-patient ratios against similar hospitals |
| Functional | Comparing specific functions with organizations known for excellence in those areas | Studying medication administration systems from hospitals with low error rates |
| Generic/Process | Comparing business processes regardless of industry | Adopting customer service practices from hospitality industry |
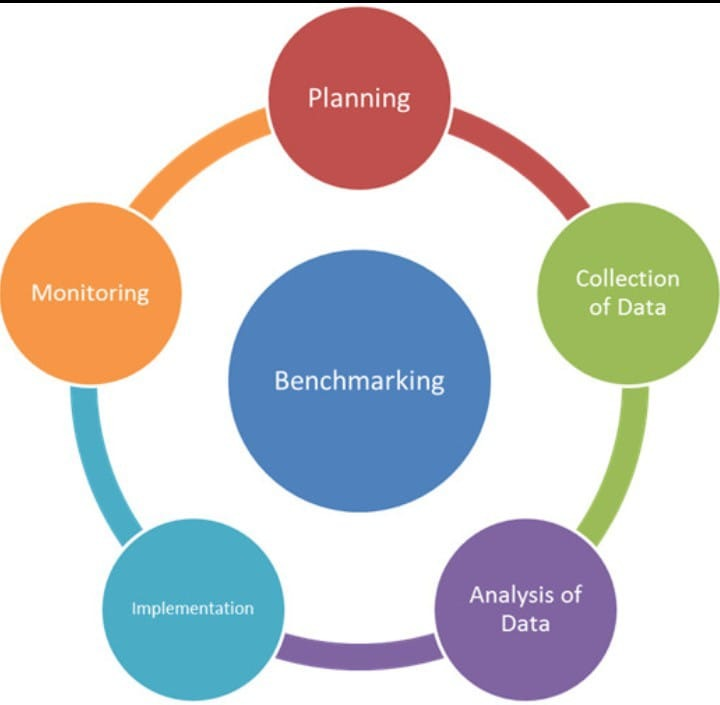
The Benchmarking Process
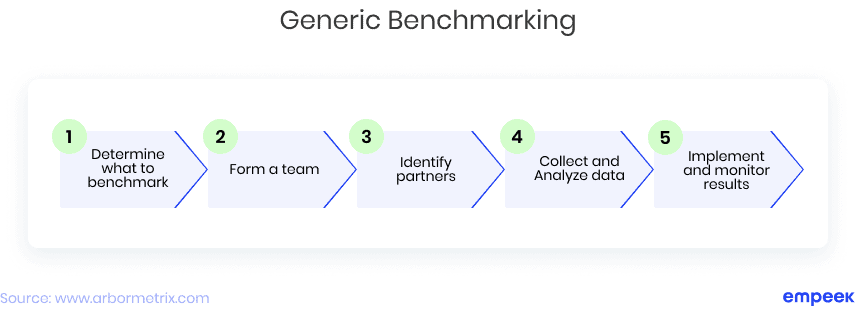
Planning
Identify what to benchmark, determine key performance indicators (KPIs), and select benchmarking partners or sources.
Data Collection
Gather internal performance data and research external benchmarks from similar organizations, industry reports, or best practice databases.
Data Analysis
Compare performance gaps, identify root causes, and determine factors contributing to superior performance in benchmark organizations.
Action Planning
Develop specific improvement strategies based on findings, set realistic targets, and create action plans with clear timelines.
Implementation
Execute improvement plans, monitor progress, and adjust strategies as needed based on feedback and interim results.
Review & Recalibration
Evaluate the effectiveness of implemented changes, recalibrate goals as needed, and incorporate benchmarking as an ongoing improvement process.
Applications of Benchmarking in Nursing
Clinical Quality Improvement
- Comparing infection rates, patient falls, medication errors, and pressure ulcer incidence
- Identifying best practices in wound care, pain management, and discharge planning
- Improving adherence to evidence-based clinical guidelines
Operational Excellence
- Optimizing nurse staffing levels and skill mix
- Improving patient flow and reducing wait times
- Enhancing resource utilization and cost efficiency
Patient Experience
- Improving patient satisfaction scores
- Enhancing communication practices with patients and families
- Reducing complaints and increasing compliments
Professional Development
- Comparing staff education approaches and results
- Improving nurse retention and recruitment strategies
- Enhancing professional advancement opportunities
Benchmarking Mnemonic: “B-E-S-T-C-A-R-E”
Remember Benchmarking with “B-E-S-T-C-A-R-E”
- B – Baseline your current performance
- E – Examine industry standards and best practices
- S – Study top performers and their methods
- T – Target specific areas for improvement
- C – Compare data systematically
- A – Adapt best practices to your setting
- R – Revise processes based on findings
- E – Evaluate results and recalibrate as needed
3. Activity Plan (Gantt Chart)
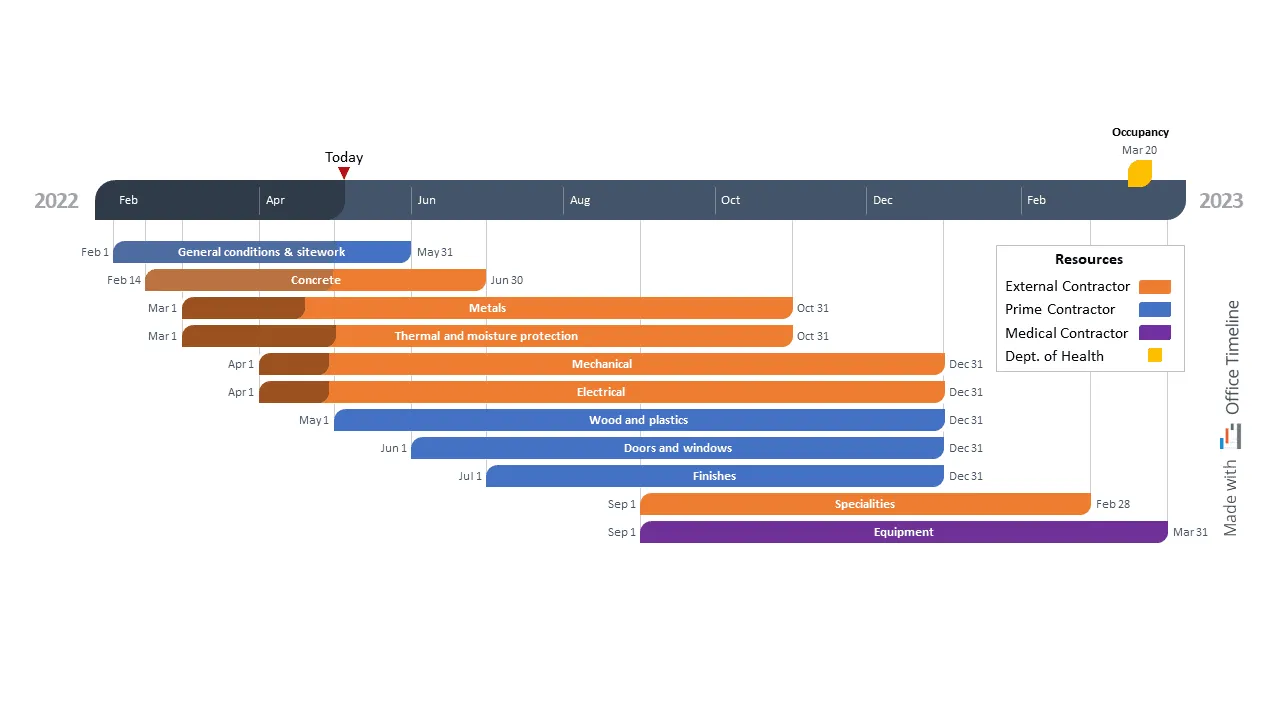
Definition: A Gantt chart is a visual project management tool that illustrates a project schedule by displaying activities as horizontal bars across a timeline, showing start and end dates, dependencies, milestones, and progress.
Developed by Henry Gantt in the 1910s, Gantt charts have become one of the most widely used project planning tools in healthcare and nursing management. They provide a clear visual timeline of tasks, making complex projects easier to understand, communicate, and track.

Key Components of Gantt Charts
- Tasks/Activities: Individual work items that need to be completed as part of the project.
- Timeline: Horizontal time axis showing the project duration, often divided into days, weeks, or months.
- Bars: Horizontal bars representing the duration of each task, with the length proportional to the time required.
- Dependencies: Arrows or links showing relationships between tasks and which must be completed before others can begin.
- Milestones: Key checkpoints or significant events in the project, often depicted as diamonds.
- Resources: People, equipment, or materials assigned to specific tasks.
- Progress Indicators: Visual markers showing how much of each task has been completed.
Creating Effective Gantt Charts for Nursing Projects
Define Project Scope and Objectives
Clearly identify what the project will accomplish, including specific deliverables and success criteria.
Break Down the Project into Tasks
Identify all tasks needed to complete the project and organize them into a logical work breakdown structure.
Sequence Tasks and Identify Dependencies
Determine which tasks must be completed in sequence and which can be done in parallel.
Estimate Task Durations
Realistically assess how long each task will take, consulting with team members who will perform the work.
Assign Resources
Determine who will be responsible for each task and what resources they will need.
Create the Chart
Use project management software (like Microsoft Project, Excel, or specialized tools) to create the Gantt chart.
Review and Refine
Review the chart with project stakeholders, ensuring it’s realistic and aligns with organizational constraints.
Update Regularly
Maintain the chart throughout the project, updating progress and adjusting timelines as needed.
Applications of Gantt Charts in Nursing
Quality Improvement Initiatives
Planning and tracking progress of multi-phase quality improvement projects like reducing medication errors or improving discharge processes.
Staffing and Scheduling
Planning staff transitions, training programs, and coverage during implementation of new staffing models.
Facility Renovations
Coordinating nursing unit renovations while maintaining patient care and minimizing disruptions.
Policy Implementation
Planning and tracking the rollout of new policies, procedures, or clinical guidelines across multiple units.
Gantt Chart Mnemonic: “G-A-N-T-T”
Remember Gantt Chart Development with “G-A-N-T-T”
- G – Group tasks into logical categories
- A – Arrange tasks in sequence with dependencies
- N – Note durations realistically
- T – Track progress visually
- T – Tweak and update as the project evolves
4. Comparison of Planning Tools
| Feature | PERT | Benchmarking | Gantt Chart |
|---|---|---|---|
| Primary Function | Project planning with uncertain timeframes | Performance improvement through comparison | Visual scheduling and progress tracking |
| Best For | Complex projects with uncertain durations | Identifying performance gaps and improvement opportunities | Simple to moderately complex projects with defined tasks |
| Visual Format | Network diagram with nodes and arrows | Various formats (charts, tables, dashboards) | Bar chart with timeline |
| Time Estimation | Three-point estimates (O, M, P) | Not primarily time-focused | Single duration estimate per task |
| Key Strength | Accounts for uncertainty in task completion times | Identifies best practices and performance gaps | Clear visual representation of project timeline |
| Key Limitation | Complex for simple projects | Requires quality comparison data | Less effective for handling uncertainty |
| When to Use in Nursing | EHR implementation, facility reorganization | Quality improvement, process optimization | Staff training, unit renovations |
Integrating Planning Tools in Nursing Management
While each of these planning tools has distinct strengths, they often work best when used together in nursing management:
- Use Benchmarking to identify performance gaps and set improvement goals
- Use PERT for initial planning of complex projects with uncertainty
- Use Gantt Charts for detailed scheduling, resource allocation, and progress tracking
Key Integration Insight: The most effective nursing leaders use these planning tools as complementary approaches rather than standalone techniques. Benchmarking identifies improvement needs, PERT helps structure complex planning initiatives, and Gantt charts provide visual tracking and communication.
5. Summary and Key Takeaways
Program Evaluation Review Technique (PERT)
- Ideal for complex nursing projects with uncertain timelines
- Uses three time estimates (optimistic, most likely, pessimistic) to account for uncertainty
- Identifies the critical path that determines minimum project completion time
- Visualizes dependencies and relationships between project activities
- Remember using the “P-E-R-T-S” mnemonic
Benchmarking
- Systematic process for comparing performance against standards or best practices
- Identifies performance gaps and improvement opportunities in nursing practice
- Multiple approaches: internal, competitive, functional, and generic
- Six-step process from planning to review and recalibration
- Remember with “B-E-S-T-C-A-R-E” mnemonic
Gantt Chart
- Visual project management tool showing tasks as horizontal bars on a timeline
- Clearly illustrates task durations, dependencies, and overall project schedule
- Effective for communicating project plans to stakeholders
- Helps track progress and identify delays in nursing projects
- Remember with “G-A-N-T-T” mnemonic
Effective project planning in nursing management requires selecting the right tools for each situation. Understanding PERT, Benchmarking, and Gantt charts provides nurse leaders with a comprehensive toolkit for planning, implementing, and monitoring projects that improve patient care and operational efficiency.
Final Thoughts
As nursing continues to evolve in complexity and scope, effective planning tools become increasingly essential. By mastering PERT, Benchmarking, and Gantt charts, nurse leaders can successfully navigate challenges, optimize resources, and implement changes that enhance healthcare quality and efficiency. The time invested in learning these planning methodologies pays dividends in smoother project execution, better stakeholder communication, and more successful outcomes in nursing management initiatives.
© 2025 Nursing Management Education Resources
Created for nursing education purposes. Content structured to support learning of project planning tools in nursing management.